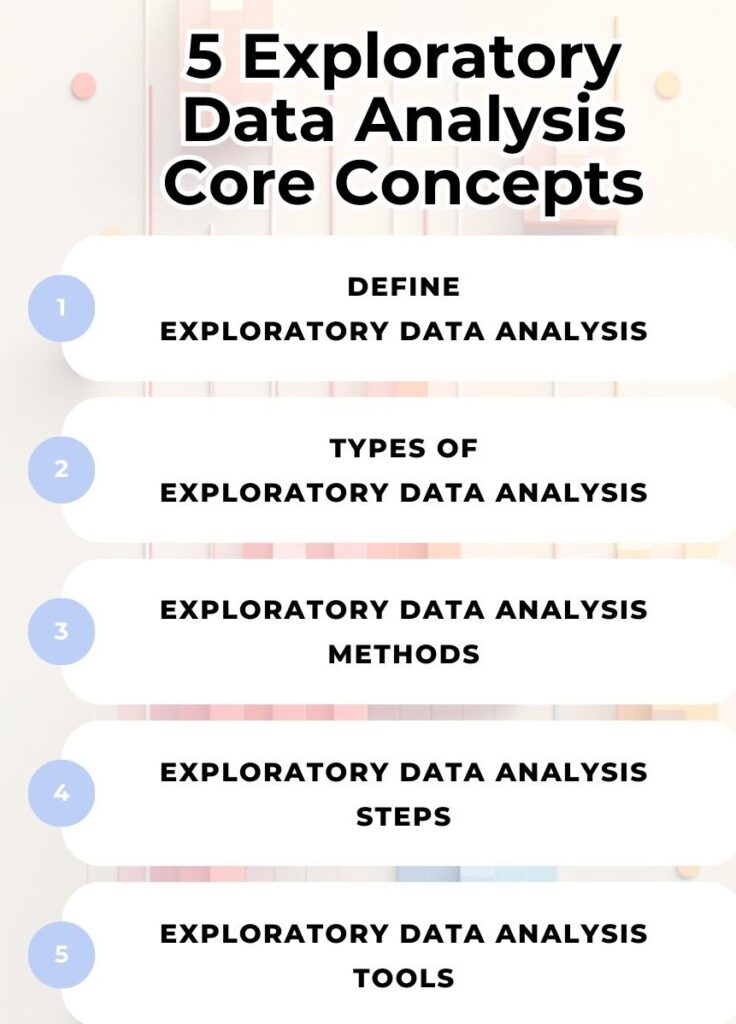
Understanding what is exploratory data analysis is important for anyone stepping into the field of data science. Exploratory Data Analysis (EDA) forms the foundation for all successful data-driven projects, allowing data scientists to uncover patterns, detect anomalies, test hypotheses, and check assumptions using summary statistics and graphical representations. In this comprehensive blog, we will discuss what is exploratory data analysis, its importance, techniques, and tools, with a special focus on learners in Kerala.
What is Exploratory Data Analysis?
Do you know “what is exploratory data analysis?” In simple terms, exploratory data analysis (EDA) is the initial step in the data analysis process, where analysts employ statistical tools and visualizations to understand the structure of data and extract useful insights. Before jumping into complex models, understanding what is exploratory data analysis is vital to avoid misinterpretations and ensure accurate predictions.

What is the Importance of Exploratory Data Analysis for Machine Learning?
Before training machine learning models, it’s essential to perform EDA. Exploratory data analysis for machine learning helps identify relationships between variables, outliers, and missing values. It also allows data scientists to decide on feature engineering and selection, both of which are critical steps for building robust models. Understanding what is exploratory data analysis prepares you to handle raw data and transform it into meaningful insights.
What is Exploratory Data Analysis with Python?
One of the most popular programming languages for EDA is Python. Exploratory data analysis with Python allows data scientists to perform powerful data manipulation and visualization with libraries like Pandas, Matplotlib, and Seaborn. By learning exploratory data analysis with Python, one can easily clean data, visualize distributions, and identify key trends.
Exploratory Data Analysis Tools in Python
- Pandas: For data manipulation and summary statistics.
- Matplotlib and Seaborn: For plotting graphs and uncovering patterns.
- Plotly: For interactive visualizations.
Exploratory Data Analysis with Python: Example Workflow
- Load the data using Pandas.
- Check for missing values and data types.
- Generate summary statistics.
- Visualize distributions using histograms.
- Create boxplots to detect outliers.
- Use scatter plots and pair plots to identify relationships.
What is Exploratory Data Analysis in R?
Apart from Python, exploratory data analysis in R is also widely used by data scientists. R provides robust statistical packages and visualization libraries like ggplot2 and dplyr, making exploratory data analysis in R both efficient and informative.
Exploratory Data Analysis in R: Example Workflow
- Load the data using read.csv or read.table.
- Use summary() and str() functions to get data insights.
- Visualize data using ggplot2.
- Check for missing data and handle them using the mice or Amelia package.
- Perform correlation analysis using cor() and visualize it with corrplot.
What is Exploratory Data Analysis for Machine Learning?
Exploratory data analysis for machine learning is about plotting graphs. Here are some best practices:
- Start with Data Cleaning: Remove duplicates and fix data types.
- Understand Data Distributions: Plot histograms and boxplots.
- Correlations: Use heatmaps to visualize relationships.
- Check Outliers and Missing Values: Replace or treat them as required.
- Feature Selection: Choose the right variables to input into models.
What are the techniques in Exploratory Data Analysis for Machine Learning?
- Univariate Analysis: Examines one variable at a time.
- Bivariate and Multivariate Analysis: Studies relationships between two or more variables.
- Missing Data Analysis: Identifies and treats missing values.
- Outlier Detection: Detects anomalies that may distort models.
- Feature Engineering: Creating new features based on insights derived during EDA.
What are Exploratory Data Analysis Tools?
There are several exploratory data analysis tools that make the process efficient:
- Tableau: Great for visual EDA.
- Power BI: Another excellent tool for visual insights.
- Python and R IDEs: Such as Jupyter Notebook and RStudio.
- KNIME and RapidMiner: Drag-and-drop platforms for non-coders.
Why Should Learners in Kerala Focus on EDA?
The demand for data science professionals in Kerala is increasing. Aspiring data scientists should focus on mastering exploratory data analysis for machine learning as it is a key part of most interviews and real-world projects. Enrolling in a Data Science Course in Trivandrum, Kerala can provide hands-on training in exploratory data analysis with Python and exploratory data analysis in R.
Common Challenges in Exploratory Data Analysis
- Handling large datasets.
- Visualizing high-dimensional data.
- Dealing with missing or corrupted data.
- Choosing the right exploratory data analysis tools.
Conclusion
Understanding what is exploratory data analysis is essential for anyone who wishes to build a successful career in data science. You can use exploratory data analysis in R or perform exploratory data analysis with Python, mastering this skill will help you identify trends, relationships, and patterns that are crucial for building accurate machine learning models.
Remember, exploratory data analysis for machine learning is just a step for your entire machine learning pipeline. By using advanced exploratory data analysis tools, you can ensure data integrity and make better business decisions. Understanding what is exploratory data analysis and practicing it regularly will elevate your data science skills.
So, if you are in Kerala and aspiring to become a data scientist, start by learning exploratory data analysis for machine learning, master exploratory data analysis with Python, and become proficient in exploratory data analysis in R using the right exploratory data analysis tools. The question what is exploratory data analysis will no longer remain a question but will become your strongest skill.


